BITCOIN MARKET UPDATE 17.DEC.2024

Hello everyone, and welcome to our BTC/USD market update. Today is December 17, 2024, and Bitcoin is currently trading at 106,460 USD. Let’s dive into the technicals, patterns, and projections using our comprehensive analysis system, including Elliott Waves, momentum indicators, and real-time data.
Bitcoin’s price action reflects a clear bullish trajectory, moving firmly in its markup phase after breaking key resistance levels over the last month. Momentum continues to build as institutions and large whales accumulate positions
Key highlights:
- Current Price: 106,460 USD.
- Major Trend: Bullish breakout on higher timeframes.
- Support Levels: 104,500 USD, 102,000 USD.
- Resistance Targets: 110,000 USD, 115,000 USD, and an extended target at 126,000 USD.
On the monthly chart, Bitcoin has entered Wave 3 of the Elliott Wave structure. Historically, this wave is the most powerful, driven by strong volume and institutional buying. Our indicators align with this projection, confirming the potential to reach the 126,000 USD level over the next weeks.
- Wave Structure:
- Wave 3 extension in progress.
- Resistance at 115,000 USD and 120,000 USD.
- Momentum Confirmation: The MACD is in a bullish crossover, and the RSI is climbing toward 80 – signaling continued strength.
Moving to the weekly chart, we see further confluence. Bitcoin has established strong support at 100,500 USD. The bullish momentum indicators confirm that the upward trend remains intact.
Zooming into the daily chart, Bitcoin has successfully broken out of its range-bound phase above 103,000 USD. This breakout signals the beginning of Wave 5 – the final push before a correction.
Key Observations:
- Support at 100,500 USD.
- Near-term target: 110,000 USD.
- Overhead resistance: 115,000 USD.
Traders should watch for any pullback toward 102,000 USD to build additional long positions as we anticipate further upside.
Now, let’s analyze the 4-hour chart. Bitcoin is forming a rising wedge pattern, with immediate support at 104,500 USD. A breakout above 108,000 USD would confirm bullish continuation toward the next resistance levels.
- Key Entry Zone: 104,500 – 102,000 USD (ideal accumulation area).
- Upside Confirmation: Break above 108,000 USD.
On the 30-minute chart, the price momentum has briefly cooled off, allowing a short consolidation phase. However, our momentum oscillators and volume profiles indicate that buyers are still in control.
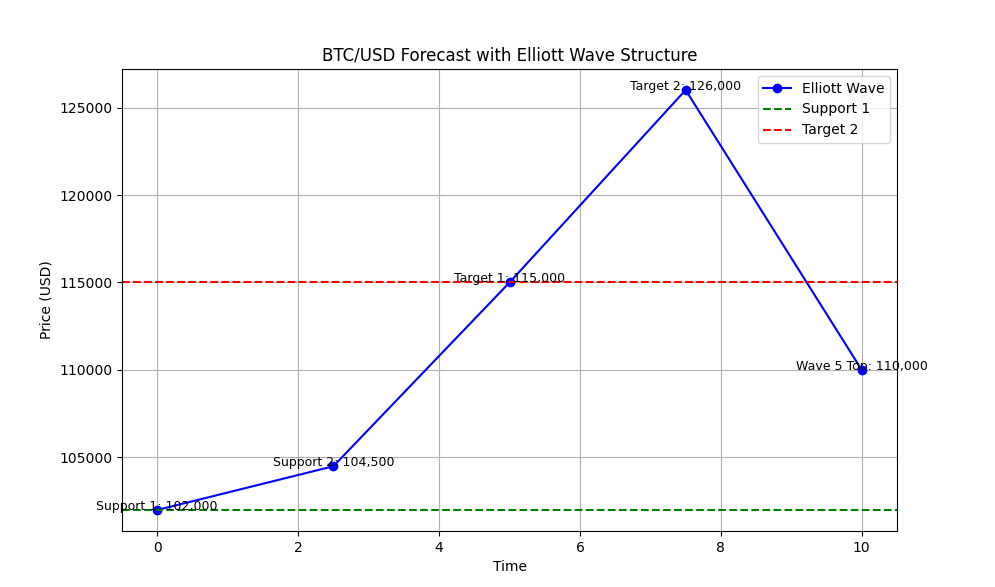
Based on our analysis, here’s the projected Elliott Wave structure:
- Wave 3 Target: 115,000 USD – the next milestone.
- Pullback to Support: Post-Wave 3 correction to 102,000 USD.
- Wave 5 Extension: Final push toward 126,000 USD, completing the larger structure.
Trade Strategy:
- Accumulate on pullbacks to 102,000 USD and 104,500 USD.
- Take partial profits at 110,000 USD and 115,000 USD.
- Monitor whale activity and on-chain data for signs of distribution at higher levels.
Whale activity remains elevated, with large transactions increasing significantly in the past 48 hours. This aligns with rising Open Interest in derivatives markets, confirming institutional participation in this breakout.
Key On-Chain Metrics:
- Net Exchange Outflows: Positive, signaling accumulation.
- Whale Wallet Growth: Continued increase in holdings.
- Funding Rates: Neutral to slightly positive, supporting further price upside.
To summarize, Bitcoin’s trajectory remains bullish on higher timeframes, with targets at 110,000 USD, 115,000 USD, and the extended level of 126,000 USD. Traders should focus on buying dips near support zones and scaling out positions as price approaches key resistance.
Key Takeaways:
- Support Zones: 104,500 USD, 102,000 USD.
- Targets: 110,000 USD – 126,000 USD.
- Strategy: Accumulate dips, monitor momentum, and take profits at resistance.
Thank you for watching today’s BTC/USD analysis. Stay disciplined, trade smart, and I’ll see you in the next update.