BTC MARKET UPDATE 19.MARCH.2025
19Mar

Hello and welcome to today's BTC/USD market analysis for March 19, 2025. Let’s dive into the latest trends, key levels, and our forecast for Bitcoin.
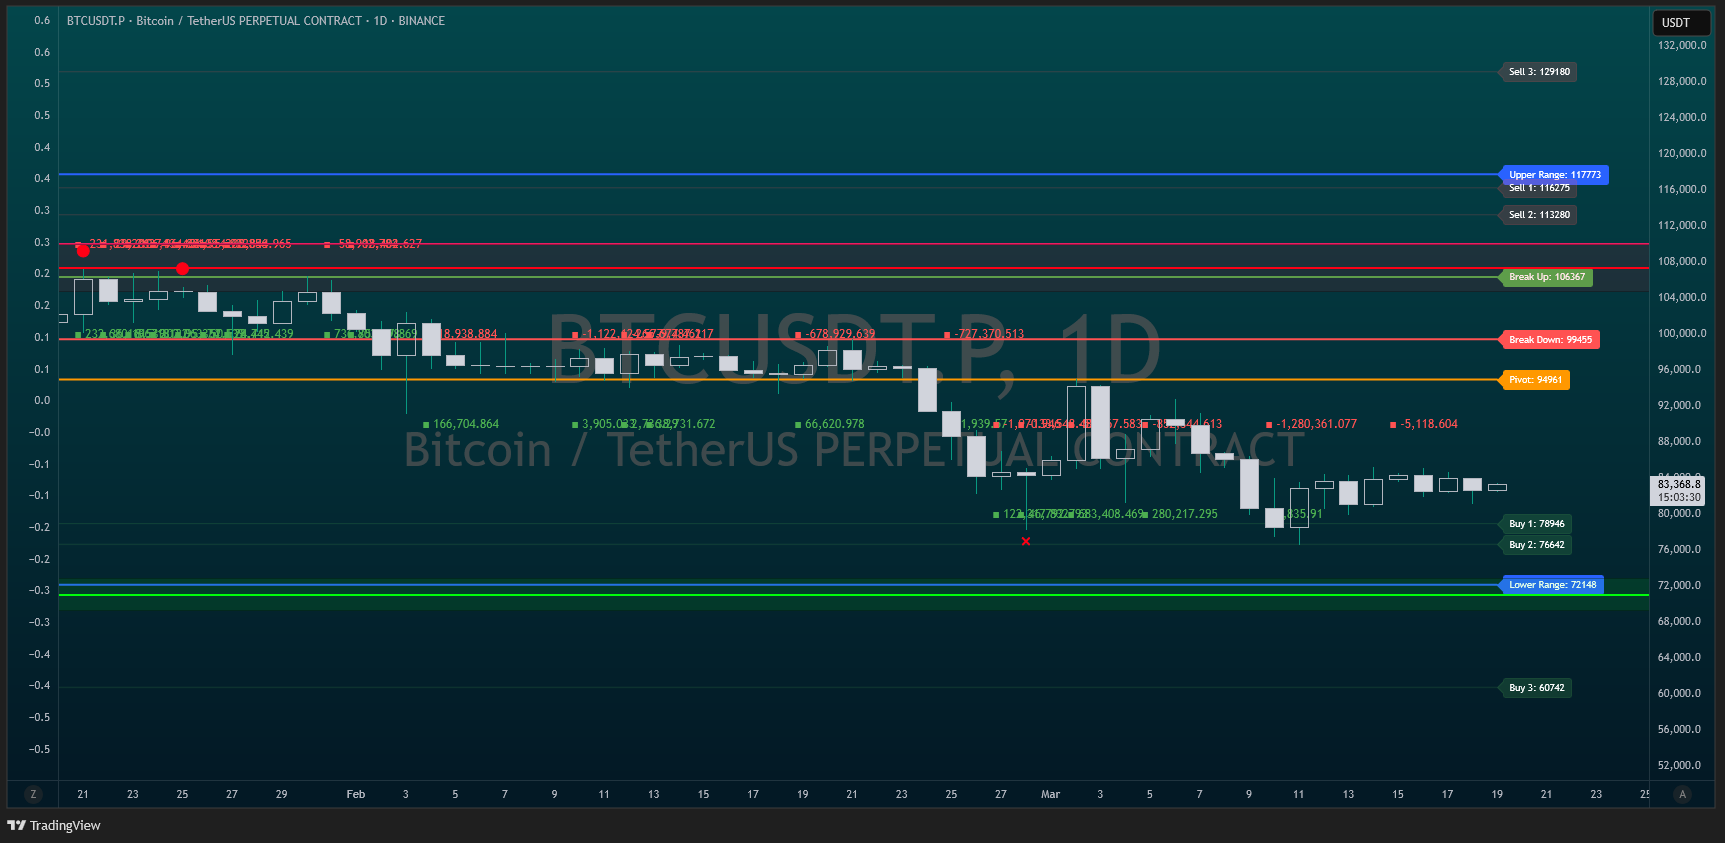
As of 09:45 GMT+1, Bitcoin is trading at $83,392. We have seen a consolidation phase after a strong uptrend, with price action stabilizing near resistance levels.
- Whale activity has shown increased accumulation around the $81,500 - $82,000 range, suggesting strong buyer interest.
- Aggregated heatmaps indicate large limit sell orders around $84,200 - $85,000, which may act as resistance in the short term.
- Liquidations: Recent data reveals short liquidations spiking above $83,000, which could trigger further momentum to the upside.
- On the 30-minute chart, Bitcoin is in a corrective wave 4, with potential for a wave 5 impulse move targeting $84,500 - $85,000.
- On the 4-hour timeframe, we remain in a larger wave 3 cycle, with Bitcoin maintaining higher lows, signaling continued bullish strength.
- The daily chart suggests a possible retracement phase, where Bitcoin could test $81,500 support before attempting another breakout.
Key Support & Resistance Levels:
- Support Zones: $81,500, $80,200, and $79,600.
- Resistance Zones: $84,200, $85,000, and $86,500.
Forecast for Next Top & Bottom:
- Next Potential Top: $85,000 around March 20, 2025, at 16:00 GMT+1.
- Next Potential Bottom: $81,200 around March 21, 2025, at 10:00 GMT+1.
In summary, Bitcoin remains in a bullish structure, with wave 5 looking to push toward $85,000 before a possible retracement. Watch key support levels and whale activity for potential reversal signals
That wraps up today’s BTC/USD market update. Stay tuned for further insights, and as always, trade smart!
Comments